WITH less than a week to go until Election Day, Asian American and Pacific Islander (AAPI) registered voters in 10 battleground states are favoring former Vice President Joe Biden and are highly motivated to cast their ballots, according to a new survey.
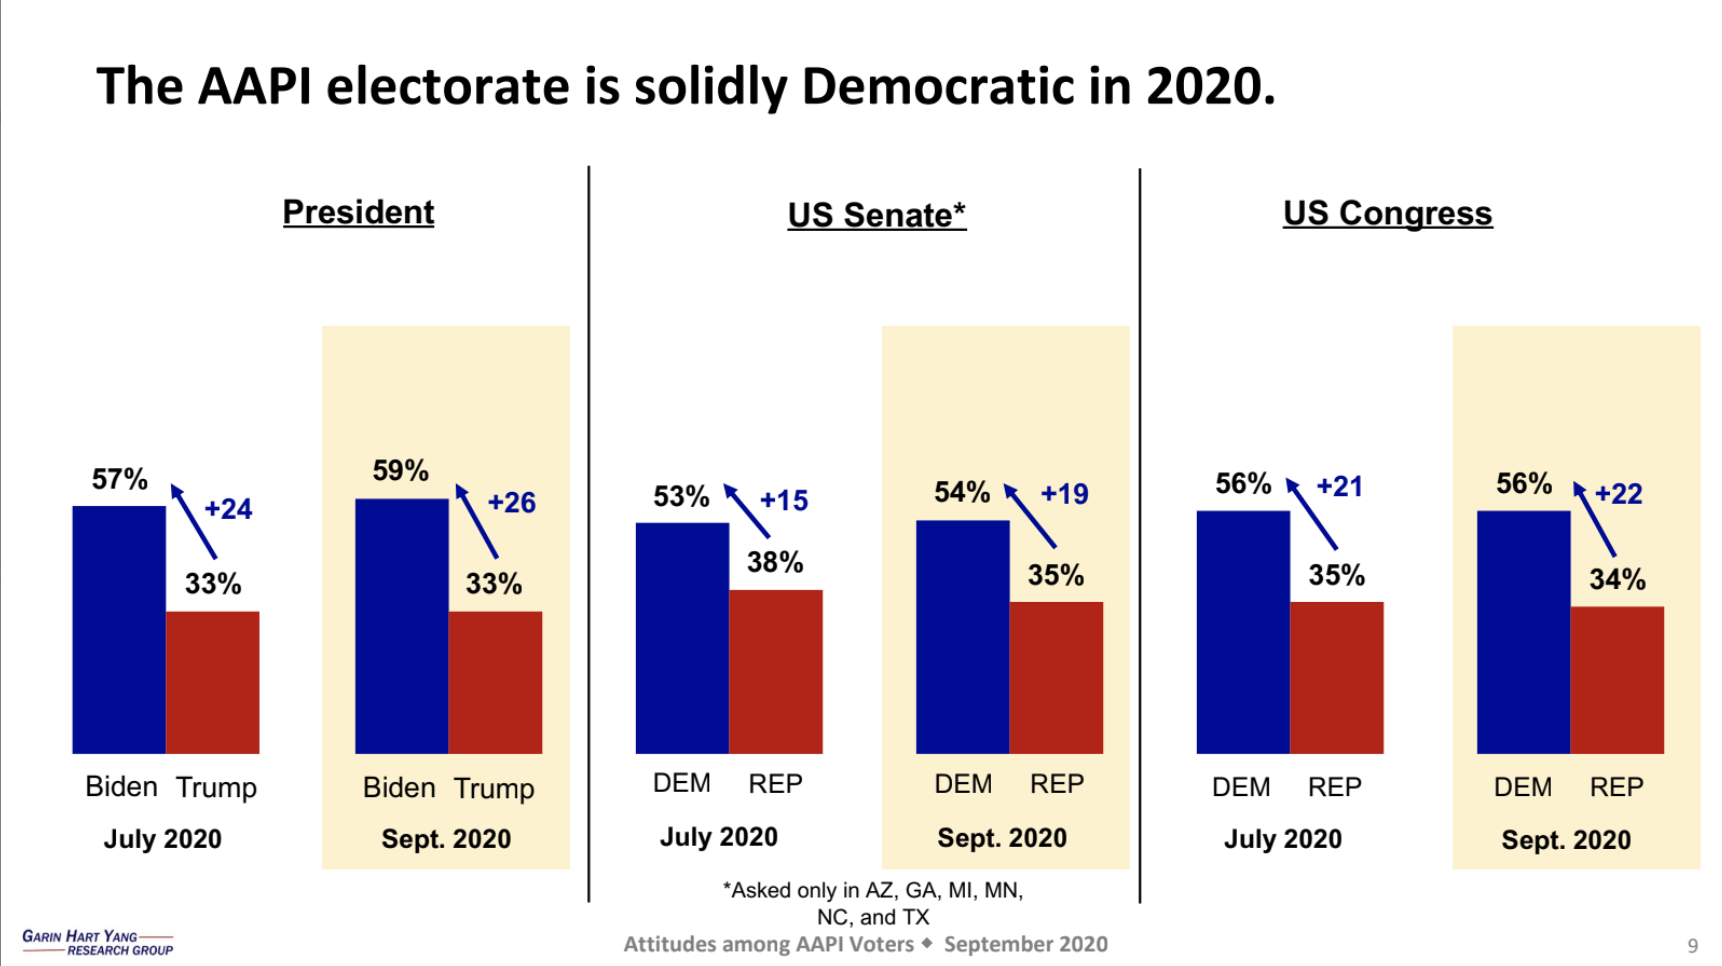
As of September, 59% of AAPI voters in key states prefer Biden, the Democratic nominee, while 33% President Donald Trump, based on a survey called “AAPI Voters and the 2020 Elections” presented by Garin-Hart-Yang Research Group, the National Education Association and the Majority Institute.
When asked about job approval rating, 64% of AAPI voters “disapprove” of the current president’s performance. Meanwhile, 47% of voters had a “positive” view of Biden, a 4% increase since July, while 34% view him negatively.
“One of the more important numbers for any incumbent, especially the president, is the approval rating — their vote share usually corresponds to their approval rating,” said Fred Yang of Garin-Hart-Yang Research Group said during a virtual presentation of the results hosted by the NEA and the Pilipino American Los Angeles Democrats on Monday, October 26.
The survey was conducted online and in English from September 16-24 among 875 registered AAPI voters in Nevada, Arizona, Texas, Wisconsin, Minnesota, Michigan, Pennsylvania, North Carolina, Georgia, and Florida. It builds on a previous survey the groups did in the same states in July.
“The API electorate has historically and often been overlooked and under-resourced in targeted electoral campaigns,” said Carrie Pugh, political director at the NEA.
Among the Biden supporters, 65% were from the Blue Wall consisting of Michigan, Wisconsin, Pennsylvania, and Minnesota. 56% were from the Southwest consisting of Arizona, Nevada, and Texas, while 60% were from the South consisting of Florida, Georgia, and North Carolina.
On the other hand, 28% of the Trump supporters were from the Blue Wall, 35% were from the Southwest, and 31% were from the South.
Sen. Kamala Harris, Biden’s running mate, got a favorability bump from July to September with 43% “positive” after she was announced on the ticket.
Though the survey did not present disaggregated data, 26% of respondents are of Chinese descent, 21% Indian and 15% Filipino. Other communities surveyed include Vietnamese, Japanese, Korean, Taiwanese and other South Asian groups.
The 10 states represent about a third of the total count of AAPI registered voters in the country, which is around 6.4 million.
The survey also found that 54% of the AAPI electorate favor the Democratic Party ticket in six states with Senate races, while 35% favor the Republican side. For Congress, 56% favor the Democrats, while 34% favor the Republicans.
Voter motivation
Heading into the election, 55% of voters are “extremely motivated” to vote compared to previous election years.
“Voters, in particular AAPI voters, are actually voting the way they’re polled,” Yang said.
Breaking the enthusiasm by age, 67% of voters over the age of 65 showed the most motivation, compared to 45% of voters between 18 to 34 years old.
The survey also asked the AAPI voters who did not vote in the 2016 elections and found that 38% of them now are extremely motivated.
Of those who said they were “not at all motivated,” the non-2016 voters had the highest rate at 6%, followed by the age group of 18 to 34 years old with 4%, and the 35 to 49 bracket with 3%. Meanwhile, the 50 to 64 age group and 65 and up were tied at 2%.
That motivation has been illustrated so far as over 500,000 more absentee ballots and early votes have been cast by AAPI voters this cycle than in 2016, and 34% of voters previously didn’t vote four years ago, Pugh said, according to Catalyst data.
“When you look at these numbers in these key battleground states, there really is a potential for the AAPI electorate to be the margin of victory,” she said.
Key issues
The survey also asked the respondents about the national issues they considered important. The four issues that received the highest rates were jobs/economy (91%), health care (89%), COVID testing (86%), and fairness/equality (85%).
“At least on issues, if not other factors, the AAPI electorate is pretty much in line with the rest of the country,” Yang said.
Of those who answered jobs/economy, 54% considered it an extremely important issue while 37% said it was very important.
Of those who answered health care, 57% said it was extremely important, while 32% said it was very important.
For COVID testing, 53% said it was extremely important, while 33% said it was very important. Meanwhile, for fairness/equality, 54% said it was extremely important, while 31% said it was very important.
The other issues rated were equal opportunity (84%), COVID recovery (83%), national security (81%), education (81%), environment (77%), racial discrimination (74%), taxes (74%), gun control (71%), and police discrimination (69%).
Method of voting
As the COVID-19 pandemic continues to ravage the country, the survey asked the voters their preferred method to vote.
Thirty-five percent of the AAPI electorate said they would vote in person. On the other hand, 30% said they would vote by mail and 17% would vote absentee/return by mail.
The majority of the electorate also said they trust voting in person, with 59% saying they trust it “a great deal,” while 32% trust it “a fair amount.”
At the end of the survey, respondents were given a box to write comments and largely commented on the importance of having AAPI-specific data, according to Yang.
“A significant number of respondents at the end of the survey understood the uniqueness of this research and expressed themselves that way,” Yang said. (Ritchel Mendiola/AJPress)


